 Caliper
cal·i·per — an instrument that measures precisely
Your Mac, measured.
Caliper is a native system monitor that lives in the menu bar: live CPU, memory, disk, network and temperature, a detailed panel behind each number, and charts that reach back a year. All for less than 1 % of one core.
Free · Developer ID-signed & notarized · macOS 15+ · Apple Silicon
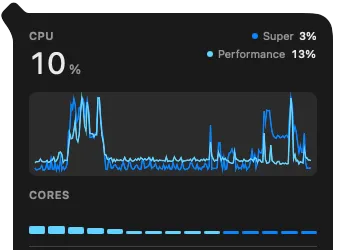
Click a module and its panel opens beneath it.
- clustersWhatever the chip calls its core groups, split out
- chartThe last minutes, one line per cluster
- coresOne bar per core, live
- belowThe load averages and the heaviest processes
the first principle
Never the load it measures
A monitor that burns a core drawing its own graphs is measuring itself. Caliper’s budget is written down, and a harness runs a release build for half an hour to report what it actually costs.
Physical footprint, not RSS: RSS counts the shared AppKit and SwiftUI pages every Mac app maps, which are resident whether Caliper runs or not.
behind every number
One panel per module, one click deep
Click a module and the full story opens under it — the telemetry Activity Monitor spreads across five tabs, in one popover.
CPU
- Whatever core clusters the chip reports, charted apart
- One bar per core, however many this Mac has, and the load averages
- The processes actually spending it, ranked
Memory
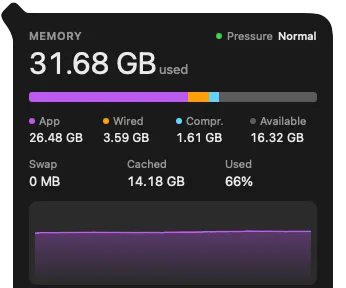
- Pressure, before the beachball tells you
- Composition: app, wired, compressed, available
- Swap in use and the heaviest consumers
Disk
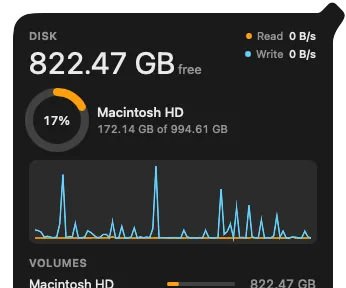
- Free space as a ring you can read at a glance
- Read and write throughput, charted live
- Drive health where the Mac reports it, and the apps hitting the disk
Network
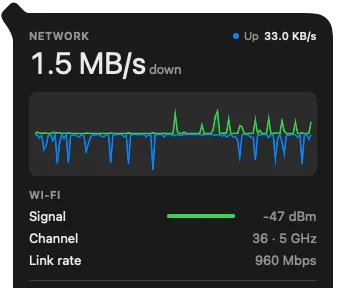
- Download and upload mirrored on one chart
- The active interfaces and their IPv4 addresses
- Wi-Fi signal, link rate, channel and band
Sensors
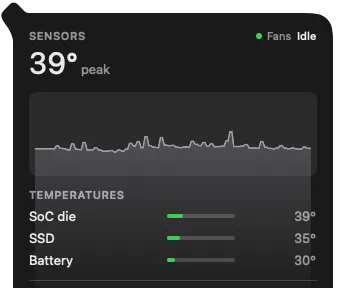
- One row per sensor group, hottest first
- Severity bars, with red kept for danger only
- Fan speeds, and a chart of the hottest sensor
…and the dashboard
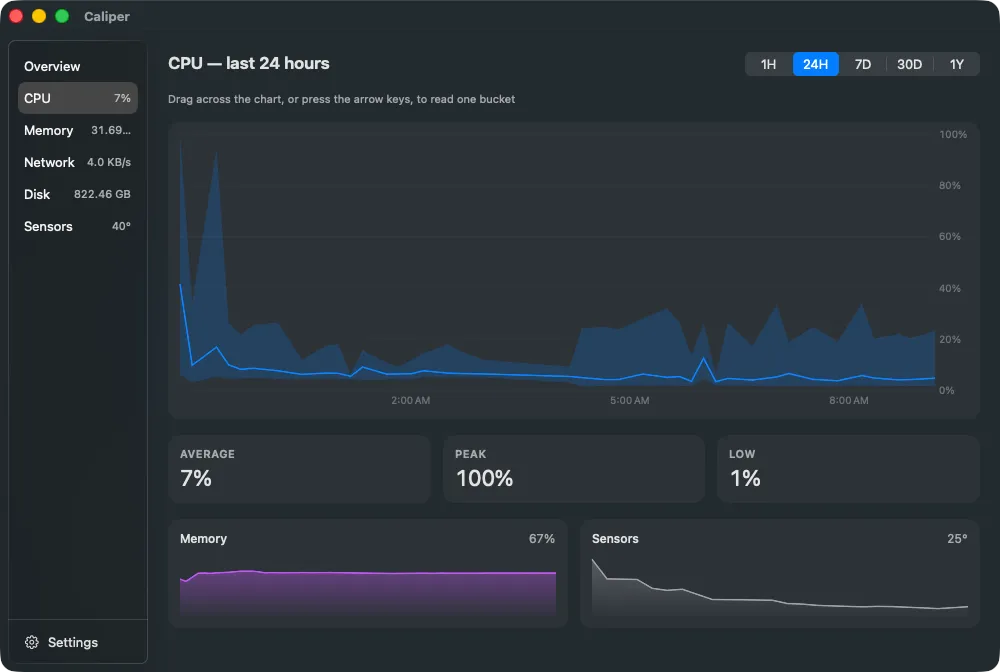
- A window for the long view: every metric charted
- Range picker from the last hour to the last year
- Grid, axes and the average, peak and low on the main chart
the memory
Real history, kept on your disk
Recording starts when the app does. Every sample lands in a local SQLite database and rolls up through four tiers, so the dashboard can chart the last hour or the last year, and the coarsest rows stay for two. Nothing is uploaded — there is no server to upload to.
your bar, your rules
A bar that holds still
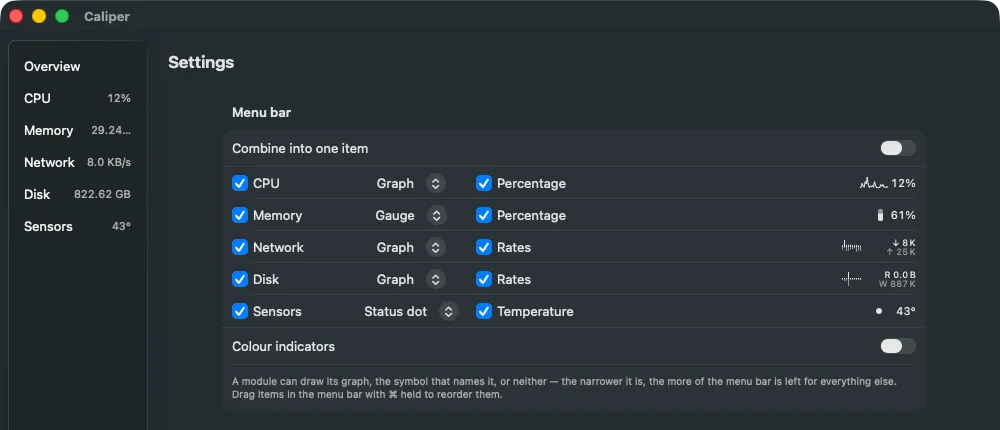
Every module draws at a fixed width, so a jump from 9 % to 88 % never moves the clock. What a module shows is decided per module — and the bar stays monochrome by default, the way menu bar icons should.
The picture
Graph, gauge, status dot or nothing at all — set per module, in the app’s own words.
The value
The number shows beside the picture or switches off. The width follows what is actually drawn.
One combined item
Modules can share a single slot, ordered by dragging — one window opens instead of five popovers.
kept honest
Signed, and quiet about updates
Developer ID, notarized
The disk image opens without a warning. Drag Caliper to Applications and it runs, the way a Mac app should.
Updates that wait their turn
A scheduled check that finds a new version marks the menu bar; it never interrupts. Every update is verified against the developer’s signature before a single file is replaced.
Direct download, on purpose
The App Store sandbox blocks the sensor interfaces a monitor needs. Caliper ships as a notarized download instead, with its update feed on GitHub.
Best-effort sensors
Sensors differ between Macs. Caliper probes at launch and shows what this machine actually reports, hiding the rest rather than filling it in.
take a measurement
Put a caliper on it
Version 0.1.0 · macOS 15 or later · Apple Silicon · free